The DASHBOARD page gives you an overview of the PCoIP Management Console’s current configuration and health, as well as the status and activity of your PCoIP deployment. You can also use the dashboard to keep track of upcoming schedules and to view their details.
An example of the PCoIP Management Console dashboard is shown below. The table that follows describes the various sections in the dashboard layout and contains links to more information about the dashboard components.
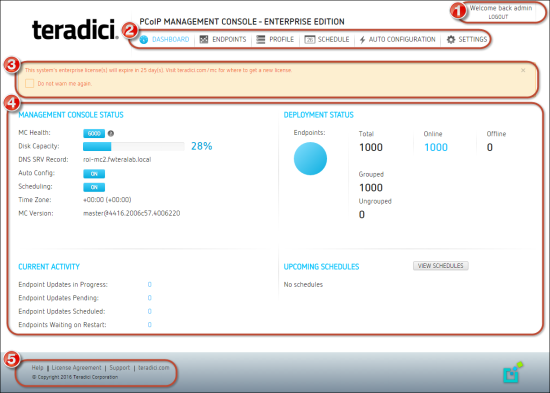
Figure 5-1: PCoIP Management Console Dashboard
Table 5-1: PCoIP Management Console Dashboard
| Area | Dashboard | Description |
|---|---|---|
|
1
|
Welcome message |
Displays the PCoIP Management Console user account for the logged in user. |
|
LOGOUT |
Lets you log out from your PCoIP Management Console session. |
|
|
2
|
DASHBOARD |
Navigates to the DASHBOARD page. The DASHBOARD button occurs at the top of all PCoIP Management Console pages. |
|
ENDPOINTS |
Navigates to the ENDPOINTS page. From this page you can structure endpoints into groups, apply profiles, discover endpoints manually, view endpoint details, and search and filter endpoints in the endpoint tables. The ENDPOINTS button occurs at the top of all PCoIP Management Console pages. |
|
|
PROFILE |
Navigates to the PROFILE page. From this page you can create, edit, duplicate, and delete profiles. The PROFILE button occurs at the top of all PCoIP Management Console pages. |
|
|
SCHEDULE |
Navigates to the SCHEDULES and schedule HISTORY pages. From these pages you can create, view, edit, and delete schedules to update groups of endpoints in the future. You can also enable and disable all schedules and view the PCoIP Management Console’s schedule history. The SCHEDULE button occurs at the top of all PCoIP Management Console pages. |
|
|
AUTO CONFIGURATION |
Navigates to the AUTO CONFIGURATION page. From this page you can configure, edit, and delete rules to automatically assign endpoints to a specific group when they are first discovered or whenever they move to or from a group. The AUTO CONFIGURATION button occurs on at the top of all PCoIP Management Console pages. |
|
|
SETTINGS |
Navigates to the SETTINGS page. From this page you can manage PCoIP Management Console users, change the time zone for your PCoIP Management Console web interface, configure a persistent naming convention for automatically naming endpoints, upload firmware and certificates to the PCoIP Management Console , manage PCoIP Management Console databases, view license information, view PCoIP Management Console version information, and configure the PCoIP Management Console log level. The SETTINGS button occurs at the top of all PCoIP Management Console pages. |
|
|
3 |
Displays the number of days remaining until the PCoIP Management Console’s license expires. If you disable this message, it will not appear again for 30 days when viewing the PCoIP Management Console using that browser. You will see it again if you access the PCoIP Management Console using a different browser that does not have the notification disabled. |
|
|
4
|
MANAGEMENT CONSOLE STATUS |
Shows the PCoIP Management Console’s status and contains information about how the PCoIP Management Console is configured:
|
|
DEPLOYMENT CONSOLE STATUS |
Displays status information about the managed endpoints in your system, such as the number that are online and offline, and the number that are grouped and ungrouped. This section also indicates important information about profiles that failed to apply. |
|
|
CURRENT ACTIVITY |
Displays the number of endpoint updates in progress, pending, and scheduled, and the number of endpoints waiting to restart. |
|
|
UPCOMING SCHEDULES |
Displays information about upcoming schedules, including the date and time they will apply. |
|
|
VIEW SCHEDULES |
Lets you open the SCHEDULE page to view details for a schedule. |
|
|
5 |
Footnote Information |
The following links occur at the bottom of every PCoIP Management Console page:
|