AWI Home Page
The AWI Home page displays a statistics summary for the Tera2 PCoIP Zero Client. You can display the Home page at any time by clicking the Home link at the top left section of the menu bar.
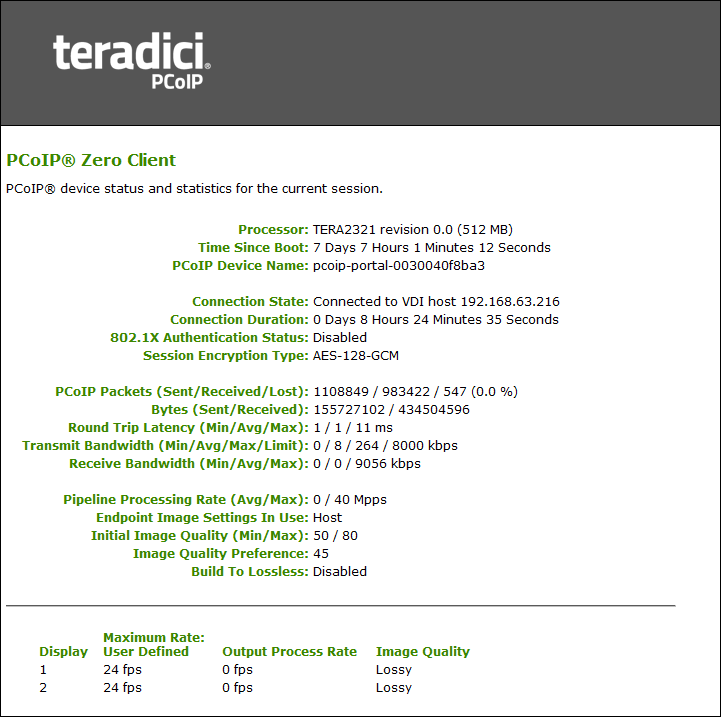
AWI: Home page
The previous figure shows session statistics for devices that can support four connected displays. If your deployment only supports two displays, information for these two displays will appear in the bottom area of the page.
AWI Home Page Statistics
| Statistics | Description |
|---|---|
| Processor | PCoIP processor type, version, and RAM size |
| Time Since Boot | Length of time that the PCoIP processor has been running. |
| PCoIP Device Name | The logical name for the device. This field is the name the client registers with the DNS server if DHCP is enabled or the system is configured to support registering the hostname with the DNS server. (See the PCoIP Device Name parameter on the Label page.) |
| Connection State | The current (or last) state of the PCoIP session. Possible connection states are:
|
| Connection Duration | Displays the length of time the device has been connected to a host endpoint. |
| 802.1X Authentication Status | Indicates whether 802.1x authentication is enabled or disabled on the device. |
| Session Encryption Type | Displays the encryption algorithm in use when a session is active. |
| PCoIP Packets Statistics | PCoIP Packets Sent: The total number of PCoIP packets sent in the current/last session. PCoIP Packets Received: The total number of PCoIP packets received in the current/last session. PCoIP Packets Lost: The total number of PCoIP packets lost in the current/last session. |
| Bytes | Bytes Sent: The total number of bytes sent in the current/last session. Bytes Received: The total number of bytes received in the current/last session. |
| Round Trip Latency | The minimum, average, and maximum round-trip PCoIP system and network latency in milliseconds (± 1 ms). |
| Bandwidth Statistics | Transmit Bandwidth: The minimum, average, and maximum traffic transmitted by the Tera processor. The active bandwidth limit is the maximum amount of network traffic the Tera processor may currently generate. The value is derived from the configured bandwidth parameters and the current (or last) network congestion levels. Receive Bandwidth: The minimum, average, and maximum traffic received by the Tera processor. |
| Pipeline Processing Rate | Shows the average and maximum amount of image data being processed by the image engine (in megapixels per second). |
| Endpoint Image Settings In Use | Displays if the image settings being used are configured within the client or within the host. This is based on how the Use Client Image Settings field is configured on the Image page for the host device. |
| Initial Image Quality | The minimum and maximum quality setting is taken from the Image page for the device. The active setting is what’s currently being used in the session and only appears on the host. |
| Image Quality Preference | This setting is taken from the Image Quality Preference field on the Image page. The value determines if the image is set to a smoother versus a sharper image. |
| Build to Lossless | Options that may appear in this field include the following: Enabled: The Disable Build to Lossless field on the Image page is unchecked. Disabled: The Disable Build to Lossless field is checked. |
| Display | The port number for the display. |
| Maximum Rate: Refresh Rate | This column shows the refresh rate of the attached display. If the Maximum Rate field on the Image page is set to 0 (that is, there is no limit), the maximum rate is taken from the monitor’s refresh rate. If the Maximum Rate field on the Image page is set to a value greater than 0, the refresh rate shows as User Defined. |
| Output Process Rate | The frame rate currently being sent from the image engine on the host to the client. |
| Image Quality | Shows the current lossless state of the attached display:
|
Clicking Reset Statistics also resets statistics on Home page
When you click the Reset Statistics button on the Session Statistics page, the statistics reported in the Home page are also reset.